
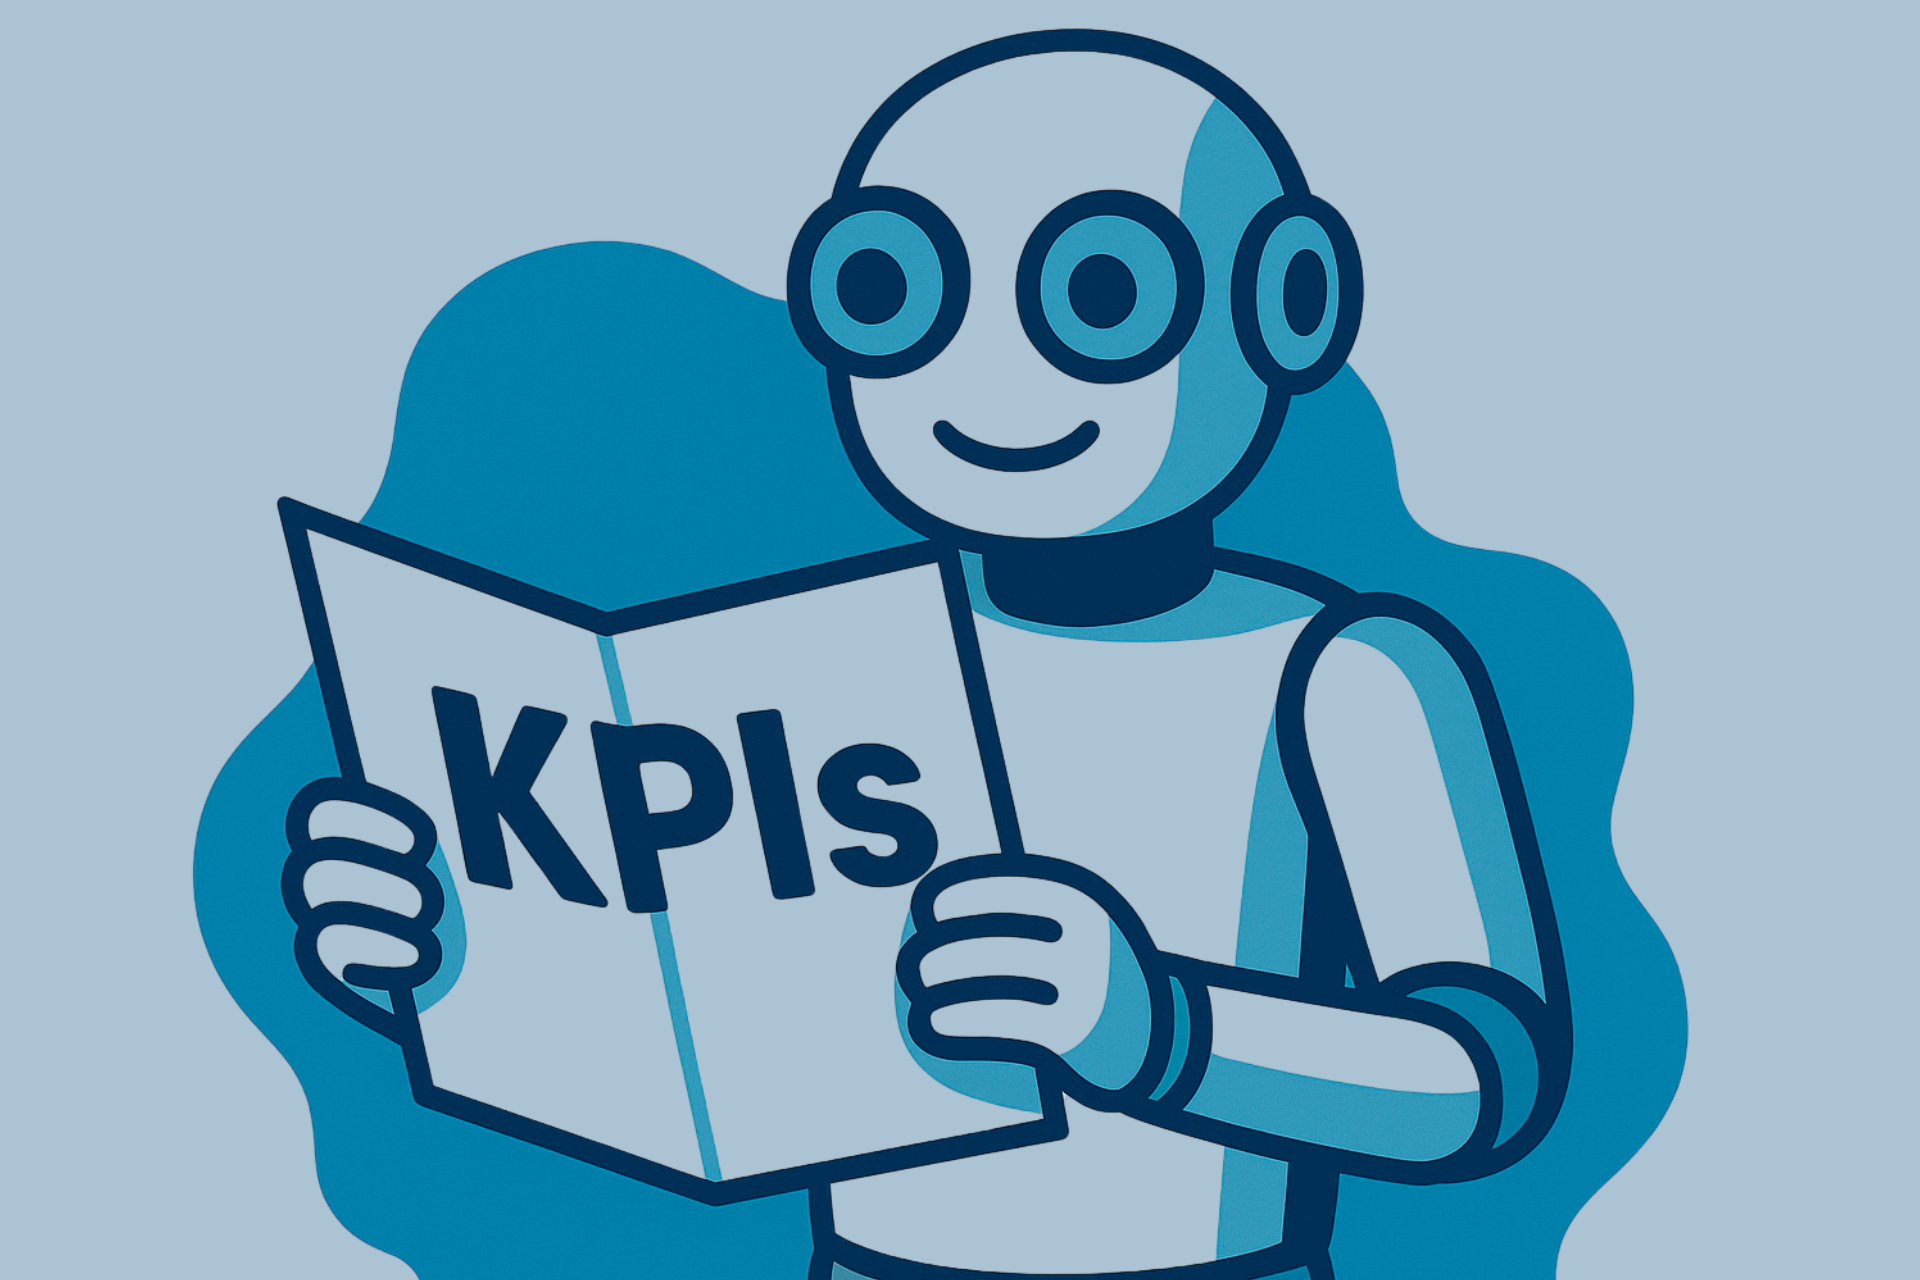
3/3: Implementation Plan: Deploying the AI-Era Demand & Sales KPIs
The Mandate for a New Measurement Framework
For over a decade, our approach to measuring B2B growth was built for a linear, predictable world of MQLs and click-based funnels. That era is over. Today, three fundamental market shifts, driven by artificial intelligence, demand a new measurement framework. First, buyer discovery is moving from traditional SEO into large language models (LLMs), changing how awareness is built. Second, the rising cost of paid acquisition is forcing a strategic shift from direct response to brand advertising, demanding better ways to measure influence. Finally, AI is now being integrated directly into the sales process, from prospecting to qualification, creating new levers for efficiency and productivity.
The strategic purpose of this implementation plan is to transition our sales organization to a modern scorecard that accurately measures the impact of AI on demand quality, pipeline efficiency, and revenue velocity. The primary objective is to establish a shared, transparent framework that connects marketing's influence on discovery and qualification with sales' ability to accelerate deal cycles, improve win rates, and enhance seller productivity.
This document outlines a disciplined, phased rollout strategy designed to ensure successful adoption of the new KPI system while minimizing operational disruption.
The Phased Rollout Strategy: A Disciplined Approach to Adoption
A phased implementation is critical for success. It allows our organization to establish essential data baselines, validate new metrics in a controlled environment, and build institutional knowledge across the sales team. This approach enables us to demonstrate early wins, fostering crucial buy-in from sales managers and individual representatives as they see the direct value of the new framework.
The rollout will proceed in three distinct phases:
Phase 1: Foundational Metrics & Baseline Establishment (Weeks 1-4): Focus on establishing a pre-AI performance baseline to accurately measure future lift.
Phase 2: AI-Driven Demand & Efficiency Tracking (Weeks 5-12): Introduce core KPIs to measure the direct impact of AI on pipeline quality, qualification, and cost-efficiency.
Phase 3: Advanced Revenue Velocity & Productivity Analysis (Weeks 13+): Deploy KPIs that measure AI's downstream impact on deal speed, customer value, and sales team productivity.
We will begin with Phase 1, the foundational work of establishing our current performance benchmarks.
Phase 1: Foundational Metrics & Baseline Establishment (Weeks 1-4)
This initial phase is the most critical step in the entire process. Its primary objective is to capture a clear, data-backed snapshot of our current performance before new AI tools and workflows are fully integrated. This baseline provides the essential benchmark against which all future AI-driven improvements in efficiency, quality, and velocity will be measured.
Overall Win Rate (15A)
Definition: The ratio of closed-won deals to all qualified opportunities in a given period (Formula: Closed-won ÷ Qualified Opportunities). This is the ultimate measure of our sales effectiveness and the primary baseline for evaluating AI's impact on deal conversion.
Implementation Action: Confirm this metric is accurately tracked in the CRM. Establish the average win rate for the preceding two quarters to serve as the official baseline.
Cost per Opportunity (CPO)
Definition: The cost to generate a single qualified opportunity (Formula: Total Spend ÷ Qualified Opportunities), representing the true customer acquisition cost (CAC) for B2B. Tracking this ensures our GTM motions remain profitable and allows us to quantify the cost-efficiency gains from AI.
Implementation Action: Work with Marketing Operations to calculate the current blended CPO across all primary channels (paid, outbound, inbound).
Sales Cycle Length (13A)
Definition: The average number of days from the first meaningful interaction with an account to a closed-won deal. This metric is a direct indicator of revenue velocity; shortening it is a key goal for our AI investments.
Implementation Action: Calculate the average sales cycle length, segmented by product tier if data is available, for the prior two quarters.
Human SQL Rate (7F)
Definition: The percentage of manual outbound sequences that result in a Sales Qualified Lead (SQL). This metric provides the crucial, unassisted performance baseline we will use to calculate the ROI of new AI sequencing tools.
Implementation Action: Isolate and measure the SQL conversion rate for all non-AI-assisted outbound prospecting efforts.
Touches to Close (14A)
Definition: The average total number of interactions (automated and manual) required to close a deal. This baseline helps us understand our current sales effort and will be used to measure AI's ability to create efficiency gains.
Implementation Action: Establish the average number of touches per closed-won deal, noting the current composition of marketing automation vs. rep-driven interactions.
With these foundational baselines established, we will be prepared to introduce AI-specific metrics and measure their direct impact in Phase 2.
Phase 2: AI-Driven Demand & Efficiency Tracking (Weeks 5-12)
With our performance baselines established, the focus of Phase 2 shifts to quantifying the direct impact of AI at the top and middle of the funnel. The KPIs introduced in this phase are designed to measure tangible improvements in pipeline quality, targeting precision, and cost-efficiency as AI-powered prospecting and qualification tools are deployed across the team.
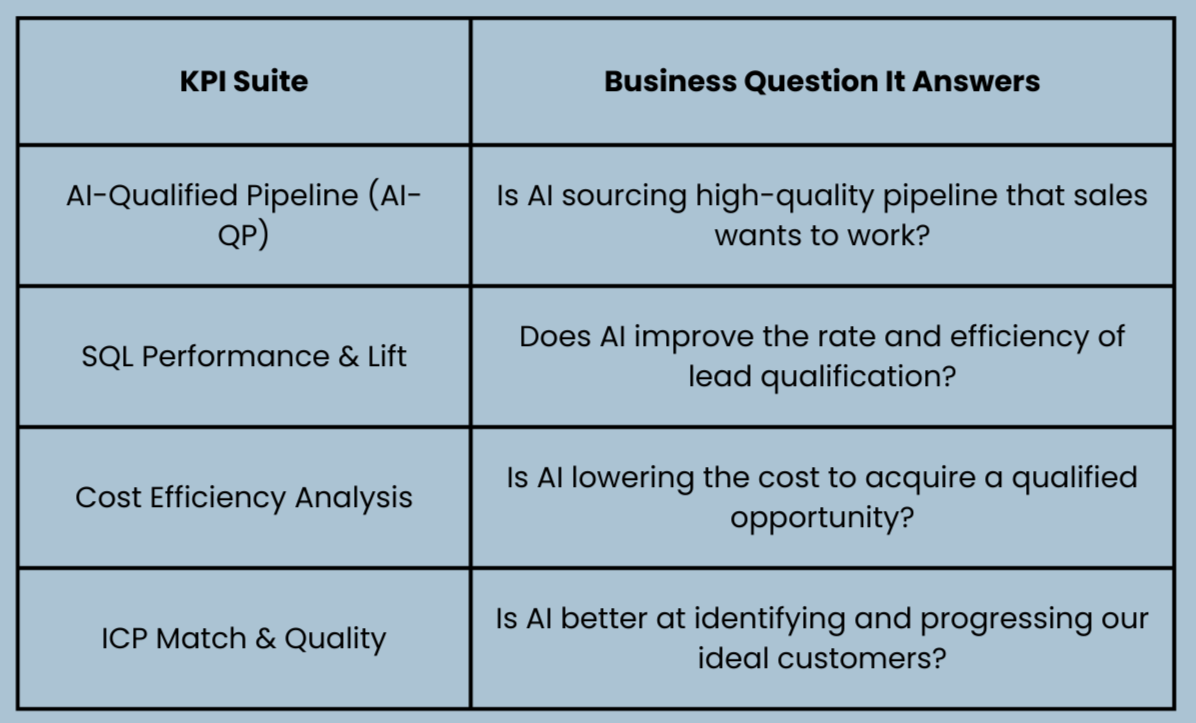
Tracking AI-Qualified Pipeline (AI-QP)
AI-Qualified Pipeline (6A): Total pipeline value generated through any AI-influenced sales or marketing motion. This tracks the raw contribution of AI to our revenue engine.
AI Pipeline Share (6B): The percentage of our total pipeline that is AI-influenced. This directly measures the adoption and impact of our AI-prospecting tools on overall pipeline generation.
AI Pipeline Share by Channel (6C): The breakdown of AI-QP contribution by source (e.g., SDR, inbound, paid). This helps us allocate resources by identifying which channels benefit most from AI.
Measuring SQL Performance & Lift
AI SQL Rate (7E): The conversion rate of SQLs from AI-powered sequences. This isolates the effectiveness of our AI tools in generating qualified leads.
AI SQL Lift (7G): The percentage improvement of the AI SQL Rate compared to the Human SQL Rate baseline from Phase 1. This provides a clear, defensible ROI metric for our AI sequencing and prospecting investments.
Analyzing Cost Efficiency
AI Cost per Qualified Opportunity (6E): The specific CPO for opportunities generated via AI-influenced motions. This isolates the acquisition cost of AI-sourced pipeline.
AI CAC Efficiency Delta (6F): The percentage difference in cost efficiency between AI-generated opportunities and non-AI opportunities. This metric proves whether our AI GTM motion is more or less expensive than our traditional one.
Validating ICP Match & Quality
ICP Match Rate (11A): The percentage of incoming leads/opportunities that AI scoring identifies as matching our Ideal Customer Profile. This measures whether AI is improving targeting precision and reducing wasted effort on poor-fit leads.
ICP Opportunity Quality Lift (11B): The win rate improvement for deals that are ICP-matched versus those that are not. This confirms that better targeting translates directly to higher revenue conversion.
Having measured the initial impact of AI on demand generation and qualification, we will proceed to Phase 3 to analyze the downstream effects on revenue and team productivity.
Phase 3: Advanced Revenue Velocity & Productivity Analysis (Weeks 13+)
This final phase focuses on measuring the cumulative business impact of AI on late-stage deal progression and overall sales team efficiency. The KPIs in this section are designed to answer the ultimate executive question: "Is our investment in AI leading to faster revenue, higher-value customers, and a more productive sales force?"
Quantifying Revenue Velocity and Win Rate Lift
AI Deal Velocity vs. Non-AI Velocity (12E): Directly compares the speed-to-revenue for deals with and without AI influence to quantify acceleration.
AI Win Rate (15B): Measures the win rate exclusively for AI-influenced deals, providing a direct performance indicator for AI's impact on deal quality and progression.
Win Rate Lift (15D): Calculates the direct percentage point improvement of the AI Win Rate over the non-AI baseline, offering a clear measure of AI's contribution to closing revenue.
Linking Sales Cycles to Customer Lifetime Value (LTV)
Sales Cycle Length vs. LTV Ratio (13B): Assesses the value created per day of the sales cycle, providing a crucial efficiency benchmark.
AI LTV vs. Non-AI LTV (13C): Determines if AI-influenced deals result in higher-value customers over the long term.
Measuring Sales Touch Efficiency
AI vs. Manual Touches (14B): Segments the number of touches to close, isolating the impact of AI automation.
Touch Efficiency Gain (14C): Calculates the percentage reduction in manual effort required to close a deal when AI is involved.
Evaluating Seller Productivity Gains
Time Spent Selling (17A): Measures the percentage of a rep's time that is dedicated to active selling activities.
AI Time Returned per Rep (17B): Quantifies the hours of administrative work per week that AI eliminates, freeing up reps to sell more.
Pipeline per Rep (17E): Tracks the amount of pipeline each rep manages, with the expectation that AI enables reps to handle more opportunities effectively.
Upon completion of this phase, we will have a comprehensive view of AI's impact, which will be maintained through a disciplined governance and reporting cadence.
Governance and Reporting Cadence
A measurement framework is only effective if it is supported by clear ownership and a consistent reporting rhythm. This section outlines the operational plan for embedding these new KPIs into the sales organization's management process to drive accountability and continuous improvement.
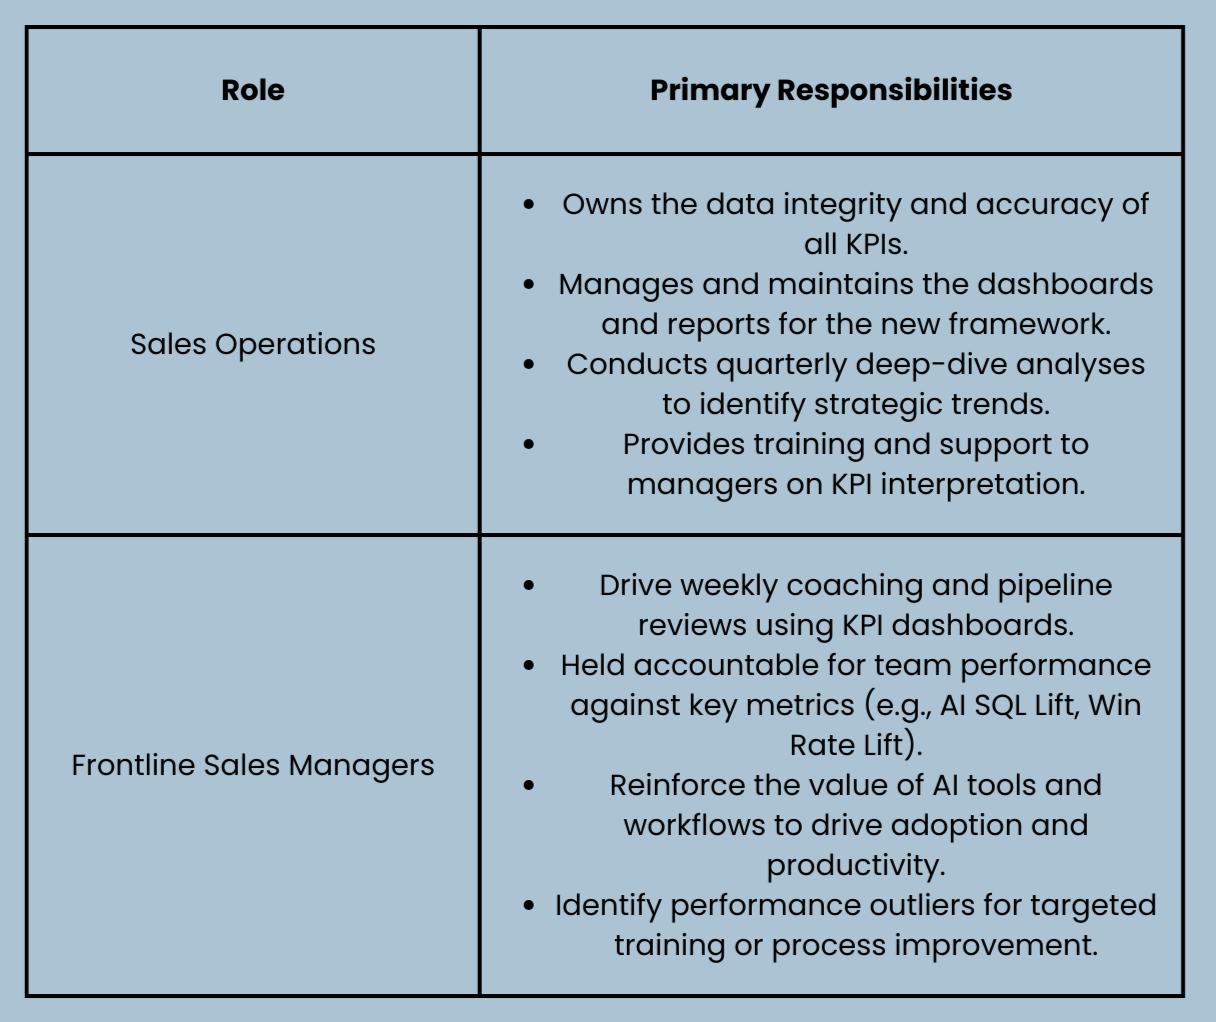
Roles and Responsibilities
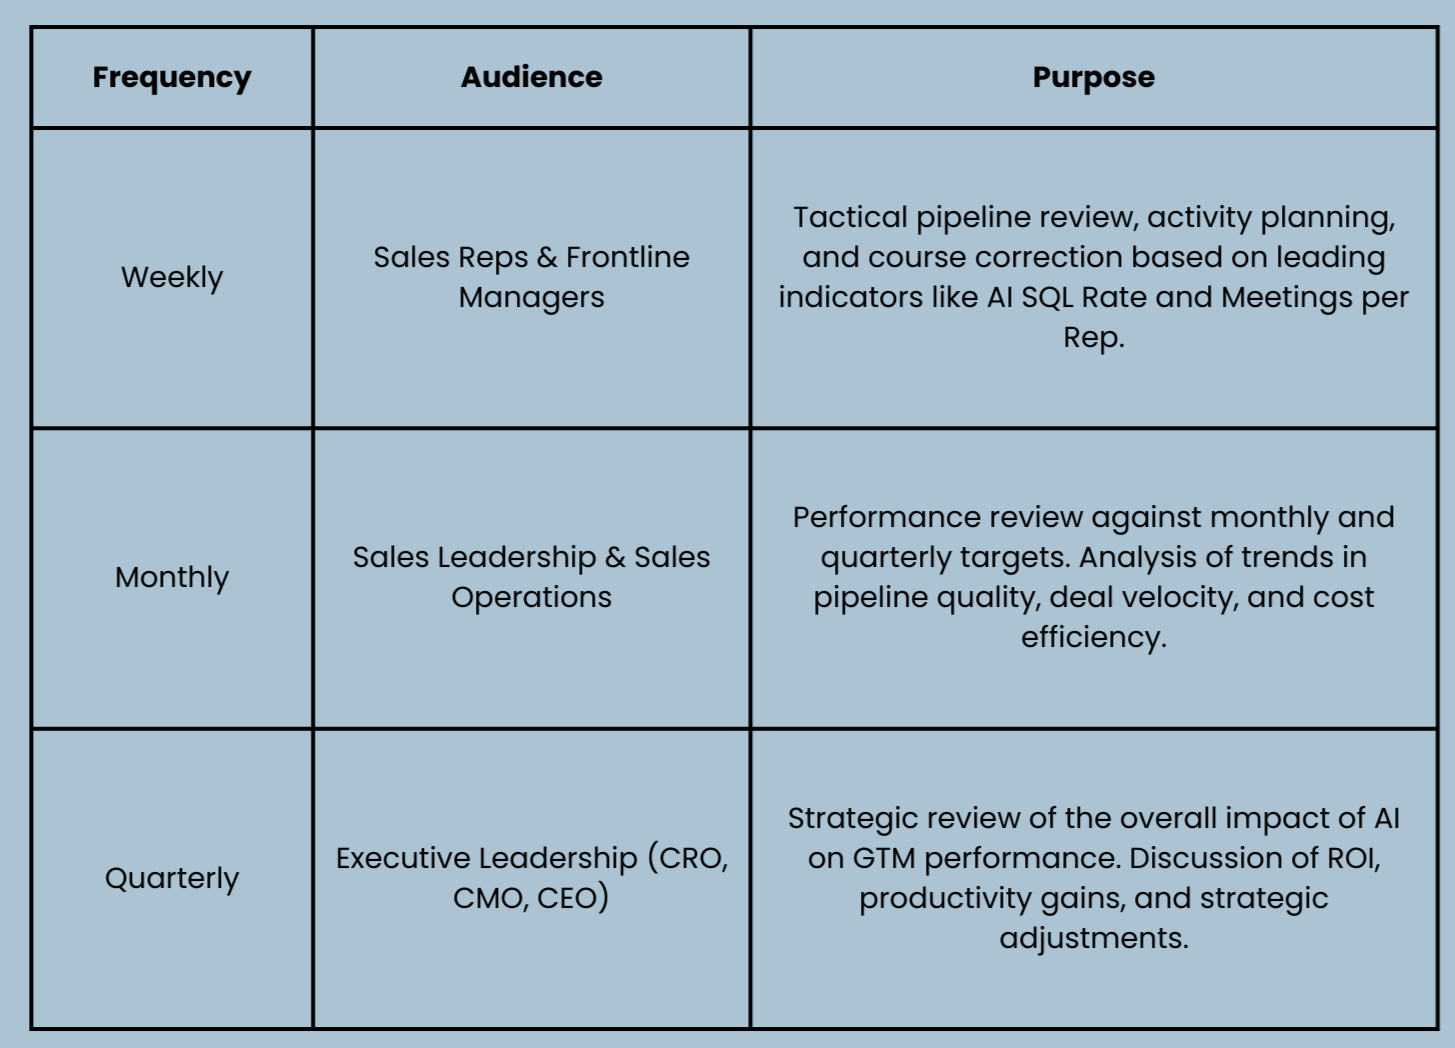
Reporting Cadence
This operational rigor will ensure the new KPIs are not just tracked, but actively used to drive better business outcomes.
Measuring Success: From Activity Metrics to Revenue Performance
The successful execution of this plan marks a critical strategic shift for our organization. We are moving away from tracking disparate, top-of-funnel activities like MQLs and toward measuring a unified revenue pipeline where the impact of AI on influence, demand quality, and deal velocity is clearly visible. The implementation of this framework will provide leadership with a clear, defensible narrative on the return on its AI investments, grounded in measurable improvements to go-to-market efficiency and overall revenue performance.
Ryan Edwards, CAMINO5 | Co-Founder
Ryan Edwards is the Co-Founder and Head of Strategy at CAMINO5, a consultancy focused on digital strategy and consumer journey design. With over 25 years of experience across brand, tech, and marketing innovation, he’s led initiatives for Fortune 500s including Oracle, NBC Universal, Sony, Disney, and Kaiser Permanente.
Ryan’s work spans brand repositioning, AI-integrated workflows, and full-funnel strategy. He helps companies cut through complexity, regain clarity, and build for what’s next.
Connect on LinkedIn: ryanedwards2