
2/3: A Glossary of Demand & Revenue KPIs for the AI Era

Why We Need a New Scorecard
For more than a decade, B2B growth ran on a predictable engine of clicks, forms, and MQLs. That era is ending, and it is ending quickly. The way customers discover, evaluate, and buy has been fundamentally reshaped by three major shifts that make the old scorecard obsolete.
These shifts are:
Search behavior is moving to Large Language Models (LLMs), where brand visibility is won through "share of voice" in an AI chat, not just organic clicks.
Paid advertising is becoming significantly more expensive, forcing companies to find more efficient ways to generate qualified pipeline.
AI is now an active assistant in the sales process, helping with everything from prospecting and qualification to research and follow-ups.
This glossary defines the essential Key Performance Indicators (KPIs) for this new era. It is a system designed for executives who need clarity, not noise, moving beyond simple activity tracking to measure what truly matters: demand quality, pipeline efficiency, and revenue velocity.
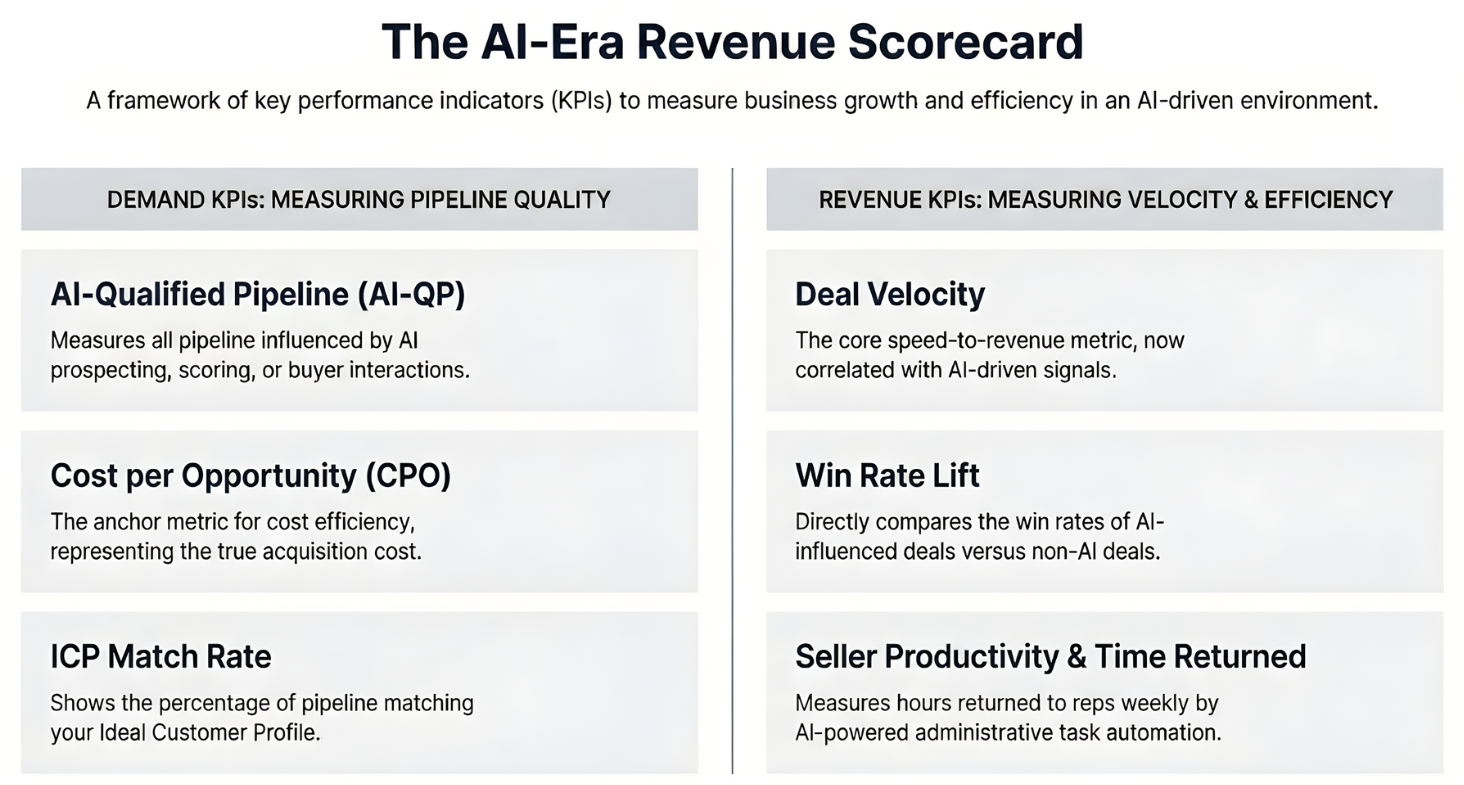
1. Demand KPIs: Measuring High-Quality Pipeline Creation
Demand KPIs have evolved to focus on the quality and efficiency of how potential customers are identified and qualified. In an era where AI can identify accounts, enrich data, and initiate conversations, these metrics show not just the volume of leads, but the measurable lift and alignment that AI provides. Let us start at the top of the funnel with the KPIs that measure how high-quality demand is created.
1.1. AI-Qualified Pipeline (AI-QP)
Any sales pipeline created or influenced by AI tools, including AI-powered prospecting, lead scoring, automated routing, or AI-backed buyer interactions.
Why It Matters:
AI-QP provides a clear narrative for leadership, connecting technology investment directly to business results. It moves beyond a simple dollar amount to answer strategic questions through sub-metrics like AI Pipeline Share (percent) (AI-QP vs. total pipeline), Pipeline Efficiency Ratio (traffic-to-pipeline conversion), and the crucial AI CAC Efficiency Delta (percent), which compares the cost of AI-generated pipeline to non-AI motions.
1.2. SQL Performance and Progression
A Sales Qualified Lead (SQL) is no longer a single number but a multi-step performance indicator that tracks a lead's journey as a mini-funnel through initial qualification.
Why It Matters:
By tracking SQL progression, teams can pinpoint exactly where AI provides a measurable lift. This requires monitoring key funnel stages like the SQL Drop-Off Rate (where leads fail to progress), the SQL to Meeting Conversion Rate, and most importantly, the AI SQL Lift (percent), which compares the success rate of AI-generated SQLs to human-generated ones to prove impact.
1.3. Cost per Opportunity (CPO)
The total cost required to create one single, qualified sales opportunity, often referred to as CAC for Qualified Opportunities (CAC-QO).
Why It Matters:
With rising CPCs, CPO has become the anchor KPI for measuring cost efficiency. It applies to both paid marketing campaigns and outbound sales efforts, providing the truest measure of what it costs to generate a legitimate sales conversation and allowing for a direct comparison between AI and non-AI channels.
1.4. High-Intent Conversion Rate
The rate at which website visitors who show strong buying signals, such as viewing a pricing page, comparing features, or interacting with AI-powered product tours, convert into qualified opportunities.
Why It Matters:
This KPI helps teams understand how effectively they are capturing demand from buyers who are actively evaluating solutions. Tracking the High-Intent AI Interaction Conversion Rate specifically shows how well AI-powered tools on your site are turning curiosity into qualified pipeline.
1.5. ICP Match Rate
The percentage of the total sales pipeline that fits the company's defined Ideal Customer Profile (ICP).
Why It Matters:
This metric, often supercharged by AI-powered scoring, is a direct measure of pipeline quality. It proves that GTM efforts are aligned. When combined with ICP Opportunity Quality Lift (percent), which compares the win rate of ICP deals to non-ICP deals, it creates an undeniable link between pipeline quality and revenue outcomes.
2. Revenue KPIs: Measuring Sales Velocity and Efficiency
Revenue KPIs measure the impact of AI at the bottom of the funnel, where opportunities become customers. These metrics reveal how AI influences how fast deals close, how efficiently sales teams operate, and ultimately, how much value is created for the business. Once a high-quality pipeline is created, the next critical step is to measure how efficiently it converts into revenue.
2.1. Deal Velocity
The core metric for measuring the speed at which a company generates revenue, calculated as:
(Number of Opportunities × Win Rate × Average Deal Size) / Sales Cycle Length
Why It Matters:
In the AI era, Deal Velocity is no longer viewed in isolation. It answers the critical question: "Do our AI-driven activities lead to faster revenue?" To find out, you must compare velocity against AI-era signals like AI brand mentions and LLM share of voice, while also segmenting AI Deal Velocity vs. Non-AI Velocity to prove a direct correlation.
2.2. Sales Cycle Length
The average time it takes for an opportunity to move from creation to a closed-won deal.
Why It Matters:
This classic metric gains new power when used to calculate the Sales Cycle Length to LTV Ratio, a sophisticated measure of the value created per day. This combined view, along with comparing AI LTV vs. Non-AI LTV, helps teams determine if AI-influenced deals not only close faster but also result in higher-value customers.
2.3. Touches to Close
The total number of interactions, including emails, calls, and meetings, required to win a deal.
Why It Matters:
This KPI directly quantifies the efficiency gains from AI. By tracking AI vs. Manual Touches, calculating the Touch Efficiency Gain (percent), and analyzing the overall Touch Composition (AI vs. human vs. automation), a team can measure precisely how AI improves sales precision and reduces the human effort required to win.
2.4. Win Rate Lift
First, Win Rate is the percentage of qualified opportunities that become closed-won deals. Win Rate Lift is the percentage increase in the win rate for deals influenced by AI compared to those that were not.
Why It Matters:
This is one of the most powerful KPIs for proving AI's ROI, as it creates a direct connection between AI-assisted activities and a higher likelihood of winning. For deeper strategic insight, leaders must segment the Win Rate by ICP Tier to confirm that AI is helping win the right deals.
2.5. Seller Productivity and Time Returned
Seller Productivity metrics measure sales team efficiency, such as meetings per rep and pipeline per rep. A key new metric is Time Returned, which measures the administrative hours for data entry, research, and notes that AI gives back to a sales rep each week.
Why It Matters:
These metrics quantify one of AI's biggest promises: reversing the trend of reps spending less than 30 percent of their time actually selling. By measuring hours returned, you prove that AI is freeing up reps to focus on building relationships and closing deals.
2.6. Revenue per Employee
A high-level metric that measures the total company revenue divided by the total number of employees.
Why It Matters:
For executives and board members, this is a macro indicator of overall go to market efficiency. In an AI-first organization, this number is expected to rise. The AI Productivity Uplift (percent) metric, which compares post-AI revenue per employee to the pre-AI version, demonstrates that AI is making the entire company more effective at generating revenue.
From Measuring Clicks to Measuring Impact
Adopting this framework is a shift in mindset. We are moving away from measuring simple activities like MQLs and toward a system that measures influence, demand quality, revenue performance, and the efficiency gains that AI delivers across the entire cycle. This new scorecard provides the clarity needed to navigate and win in the AI era, a system designed for
Ryan Edwards, CAMINO5 | Co-Founder
Ryan Edwards is the Co-Founder and Head of Strategy at CAMINO5, a consultancy focused on digital strategy and consumer journey design. With over 25 years of experience across brand, tech, and marketing innovation, he’s led initiatives for Fortune 500s including Oracle, NBC Universal, Sony, Disney, and Kaiser Permanente.
Ryan’s work spans brand repositioning, AI-integrated workflows, and full-funnel strategy. He helps companies cut through complexity, regain clarity, and build for what’s next.
Connect on LinkedIn: ryanedwards2